Maps of Solar Radiation in Italy
This page contains the twelve monthly maps of daily averaged monthly values maps and the annual average map, relating
to the Italian region, of Global Horizontal Irradiation (GHI) and Direct Normal Irradiation (DNI).
The averages refer to the period 2006 ÷ 2022 (17 years).
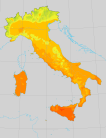
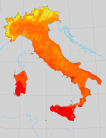
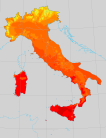
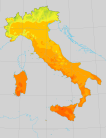
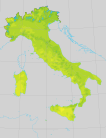
Maps of Global Horizontal Radiation (GHI) in Italy. Monthly average values (time period 2006÷2022):
| January |
February |
March |
April |
May |
June |
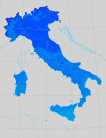 |
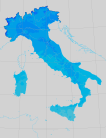 |
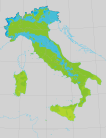 |
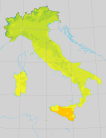 |
 |
 |
| July |
August |
September |
October |
November |
December |
 |
 |
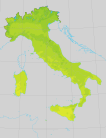 |
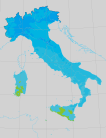 |
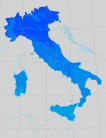 |
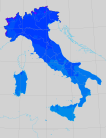 |
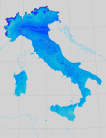
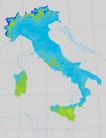
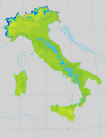
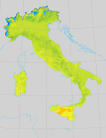
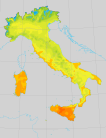
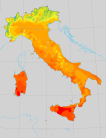
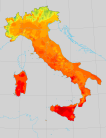
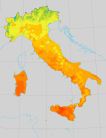
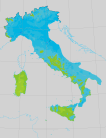
Maps of Direct Normal Irradiance (DNI) in Italy. Monthly average values (time period 2006÷2022):
| January |
February |
March |
April |
May |
June |
 |
 |
 |
 |
 |
 |
| July |
August |
September |
October |
November |
December |
 |
 |
 |
 |
 |
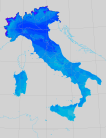 |
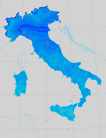
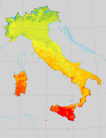
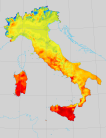
Map of Global Horizontal and Direct Normal Irradiation in Italy. Annual average values (time period 2006÷2022):
 |
 |
| (GHI) |
(DNI) |
Translation of Italian terms in the maps:
| Italia |
Italy |
| Mappe della radiazione solare |
Maps of Solar Radiation |
| Radiazione globale orizzontale |
Global Horizontal Irradiation |
| Radiazione Ddretta normale |
Direct Normal Irradiation |
| Mese |
Month |
| Anno |
Year |
| Intervallo annuo |
Time period |
| Media annua |
Yearly average |
| Gennaio |
January |
| Febbraio |
February |
| Marzo |
March |
| Aprile |
April |
| Maggio |
May |
| Giugno |
June |
| Luglio |
July |
| Agosto |
August |
| Settembre |
September |
| Ottobre |
October |
| Novembre |
November |
| Dicembre |
December |
References
The general references of Solar Radiation could be foung on this page.
The references and procedures used for presented maps could be found on this page.
|

